Bidenomics or Trumponomics? That is the question. With one year until the 2024 election, US voters will peek at their household balance sheets and determine if they are better off now than they were a year ago. How about six years ago? The Bureau of Economic Analysis (BEA) quietly published a report that contains data revisions ranging from 2017 to 2022. The federal agency’s adjustments to statistics like the gross domestic produce and inflation can be summarized this way: former President Donald Trump had a stronger economy than first reported, and President Joe Biden is overseeing a weaker economy than what the official numbers have stated.
Bidenomics vs Trumponomics
Should the public take the data too seriously? If the BEA’s “Results of the 2023 Comprehensive Update of the National Economic Accounts” report is anything to go by, it might be more prudent to wait a few years to determine if the figures are an accurate representation of the current health of the economy. Researchers have been going back in time to clean up the data by removing fluctuations, like seasonal weather patterns and holidays, to help make datasets simpler to analyze and interpret.
Put simply, US economic activity has been weaker or not as strong as initially estimated since the aftermath of the coronavirus pandemic, with the downgrades attributed to consumer spending.
The holy grail for politicians and economists is the GDP, a measurement of all goods and services produced within the US economy over a specific period. According to the BEA, real GDP under Trump was higher than first reported: 2.5% in 2017 (previously 2.2%), 3% in 2018 (previously 2.9%), 2.5% in 2019 (previously 2.3%), and negative 2.2% (previously negative 2.8%). By comparison, real GDP was revised lower in the first two years of the Biden administration: 5.8% in 2021 (previously 5.9%) and 1.9% in 2022 (previously 2.1%).
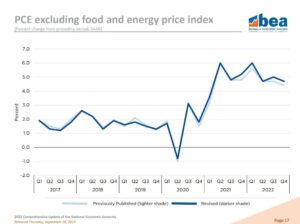
On the inflation front, prices were overestimated in the Trump presidency and underestimated in the Biden era. The personal consumption expenditure (PCE) price index, excluding the volatile energy and food components, was mainly lower than the BEA’s first estimates from 2017 to 2020. The PCE was also much higher in 2021 and 2022 than first reported.
 The personal savings rate – personal saving as a percentage of disposable personal income – was downgraded under both administrations. In other words, people saved far less than first believed. In fact, the downward revisions date back to 1995, meaning the amount of savings in the country has been lower for the last three decades.
Revisions, Revisions, Revisions
As Liberty Nation reported, 2023 has been the year for revisions. The BEA, the Bureau of Labor Statistics, and other entities in Washington have been constantly adjusting the data down, particularly the labor numbers. Approximately 355,000 jobs have been eliminated from the economic landscape from January to July due to month-to-month changes in the dataset. How much will have been lost in the upcoming non-farm payroll reports? The statisticians say that the more data they collect, the more accurate the depiction of the overall marketplace. But, at least on the jobs front, the frequency and size have raised some eyebrows about the way the figures are gathered and analyzed.
Too Little Too Late
In the end, with the economy typically playing a major role in every election cycle and in the global financial markets, the BEA’s latest multi-year revisions could cause for concern and threaten the integrity of what is reported. Indeed, many experts routinely question the validity of Chinese economic data because it is easy to distort and manipulate. Is America China? Perhaps not, but Americans’ skepticism might be warranted by the treasure trove of divergences, randomness, and better-than-expected prints. Should President Biden win re-election and serve until early 2029, what will the BEA say about Bidenomics in the next few years?

